
The markets are reaching new highs as is the Buffett Indicator. Is it time to get out?
The Buffet Indicator is the percentage of total market cap (TMC) relative to the US GNP. It is a leading indicator similar to a company’s price to earnings (P/E) ratio, that is, what we are paying (price) for what we are are getting (earnings), but it applies to the entire economy rather than to individual stocks. So yes, the Buffet Indicator is in dangerous territory. Concerning individual securities, stock pickers (not our members) are having a difficult time finding stocks with sufficiently low price to earnings ratios to qualify as bargains.
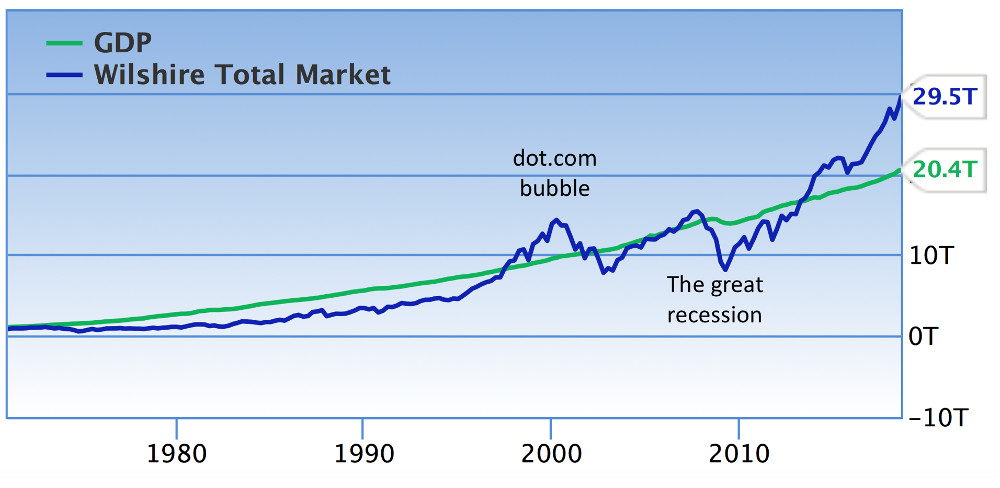
Both the Buffett and the P/E ratio indicators are aligned with another indicator, namely, reversion to the mean. The GDP line in the chart above is a good approximation of the mean. That stocks will revert and go below it, is a certainty but no one knows when that will happen.
Is it time to get out? How do Monday Morning Millionaire Program members deal with this worrisome situation?
YOU NEED TO LOGIN TO VIEW THE REST OF THE CONTENT OR LEAVE A COMMENT. Please Login. Not a Member? You can now sign up for $12 for a one-year membership. Join Us